Histogramm: Unterschied zwischen den Versionen
Keine Bearbeitungszusammenfassung |
|||
| (16 dazwischenliegende Versionen desselben Benutzers werden nicht angezeigt) | |||
| Zeile 15: | Zeile 15: | ||
</gallery> | </gallery> | ||
===Histogramm der Binomialverteilung=== | ===Histogramm der Binomialverteilung=== | ||
Die folgende interaktive Grafik zeigt das Histogramm der [[Binomialverteilung|<math>B(n;p;k)</math>]]-verteilten [[Zufallsvariable|Zufallsvariablen]] <math>X</math> sowie eine grafische Darstellung der [[Binomialverteilung#Sigmaregeln|Sigmaregeln]]. Dabei gilt | |||
*<math>P\left(\mu-\sigma\leq X\leq \mu+\sigma\right)=P(|X-\mu|\leq \sigma)\approx0,683</math>, d. h. die Werte der Zufallsvariablen <math>X</math> liegen mit einer Wahrscheinlichkeit von ungefähr 68,3 % im Intervall <math>[\mu-\sigma;\mu+\sigma]</math>. | |||
*<math>P\left(\mu-2\sigma\leq X\leq \mu+2\sigma\right)=P(|X-\mu|\leq 2\sigma)\approx0,955</math>, d. h. die Werte der Zufallsvariablen <math>X</math> liegen mit einer Wahrscheinlichkeit von ungefähr 95,5 % im Intervall <math>[\mu-2\sigma;\mu+2\sigma]</math>. | |||
*<math>P\left(\mu-3\sigma\leq X\leq\mu+3\sigma\right)=P(|X-\mu|\leq 3\sigma)\approx0,997</math> mit <math>\sigma \geq 3</math> , d. h. die Werte der Zufallsvariablen <math>X</math> liegen mit einer Wahrscheinlichkeit von ungefähr 99,7 % im Intervall <math>[\mu-3\sigma;\mu+3\sigma]</math>. Die Wahrscheinlichkeit <math>P(X \leq k)</math> wird berechnet, indem die Höhen aller Säulen, die zu Werten gehören, die kleiner oder gleich <math>k</math> sind, addiert werden. | |||
<html> | |||
<div id="binomBoard" style="width: 90vw; max-width: 600px; height: 60vw; max-height: 500px; margin-top:20px;"></div> | |||
<script type="text/javascript" src="https://jsxgraph.org/distrib/jsxgraphcore.js"></script> | |||
<script type="text/javascript"> | |||
JXG.Options.text.useMathJax = true; | |||
// Board initialisieren | |||
var brd = JXG.JSXGraph.initBoard('binomBoard', { | |||
axis: true, | |||
boundingbox: [-6.5, 0.2, 50, -0.05], | |||
showCopyright: false, | |||
showNavigation: false, | |||
defaultAxes: { | |||
x: { | |||
withLabel: true, | |||
name: 'k', | |||
label: { | |||
position: 'rt', | |||
offset: [5, 15], | |||
fontSize: 12 | |||
} | |||
}, | |||
y: { | |||
withLabel: true, | |||
name: 'P(X = k)', | |||
label: { | |||
position: 'rt', | |||
offset: [-45, -5], | |||
fontSize: 12 | |||
} | |||
} | |||
} | |||
}); | |||
// --- Slider --- | |||
// n-Slider | |||
var nSlider = brd.create('slider', [[5, 0.185], [40, 0.185], [50, 150, 200]], { | |||
name: 'n', | |||
snapWidth: 1, | |||
fillColor: 'white', | |||
strokeColor: '#3498db', | |||
highlightStrokeColor: '#3498db', | |||
baseline: {strokeColor: '#3498db', strokeWidth: 2}, | |||
highline: {strokeColor: '#2980b9', strokeWidth: 3} | |||
}); | |||
// p-Slider | |||
var pSlider = brd.create('slider', [[5, 0.175], [40, 0.175], [0, 0.1, 0.2]], { | |||
name: 'p', | |||
snapWidth: 0.01, | |||
fillColor: 'white', | |||
strokeColor: '#e74c3c', | |||
highlightStrokeColor: '#e74c3c', | |||
baseline: {strokeColor: '#e74c3c', strokeWidth: 2}, | |||
highline: {strokeColor: '#c0392b', strokeWidth: 3} | |||
}); | |||
// k-Slider (neu) | |||
var kSlider = brd.create('slider', [[5, 0.165], [40, 0.165], [0, 10, 50]], { | |||
name: 'k', | |||
snapWidth: 1, | |||
fillColor: 'white', | |||
strokeColor: '#2ecc71', | |||
highlightStrokeColor: '#2ecc71', | |||
baseline: {strokeColor: '#2ecc71', strokeWidth: 2}, | |||
highline: {strokeColor: '#27ae60', strokeWidth: 3} | |||
}); | |||
// --- Hilfsfunktionen --- | |||
function binomProb(n, k, p) { | |||
var x, p1 = 1, | |||
p2 = 1, | |||
coeff = 1; | |||
for (x = n - k + 1; x < n + 1; x++) { | |||
coeff *= x; | |||
} | |||
for (x = 1; x < k + 1; x++) { | |||
coeff /= x; | |||
} | |||
for (x = 0; x < k; x++) { | |||
p1 *= p; | |||
} | |||
for (x = 0; x < n - k; x++) { | |||
p2 *= (1 - p); | |||
} | |||
return coeff * p1 * p2; | |||
} | |||
// Berechne Erwartungswert und Standardabweichung | |||
function getMu() { | |||
var n = Math.round(nSlider.Value()); | |||
var p = pSlider.Value(); | |||
return n * p; | |||
} | |||
function getSigma() { | |||
var n = Math.round(nSlider.Value()); | |||
var p = pSlider.Value(); | |||
return Math.sqrt(n * p * (1 - p)); | |||
} | |||
// --- Balken vorbereiten --- | |||
var maxBars = 200; | |||
var bars = []; | |||
for (let k = 0; k <= maxBars; k++) { | |||
let heightF = function() { | |||
var n = Math.round(nSlider.Value()); | |||
var p = pSlider.Value(); | |||
if (k > n || k > 75) return 0; | |||
return binomProb(n, k, p); | |||
}; | |||
// Alle Balken in orange | |||
let colorF = function() { | |||
return '#ffaa44'; | |||
}; | |||
var poly = brd.create('polygon', [ | |||
[k - 0.5, 0], | |||
[k - 0.5, heightF], | |||
[k + 0.5, heightF], | |||
[k + 0.5, 0] | |||
], { | |||
withLines: true, | |||
borders: {strokeWidth: 1, strokeColor: '#cc8800'}, | |||
fillOpacity: 0.7, | |||
fillColor: colorF, | |||
vertices: {visible: false}, | |||
visible: function() { | |||
if (k <= Math.round(nSlider.Value())) { | |||
return k <= 75; | |||
} | |||
return false; | |||
} | |||
}); | |||
bars.push(poly); | |||
} | |||
// --- Sigmaregeln Visualisierung --- | |||
// Vertikale Linien für μ, μ±σ, μ±2σ, μ±3σ (nur unterhalb der x-Achse) | |||
var muLine = brd.create('segment', [ | |||
function() { return [getMu(), 0]; }, | |||
function() { return [getMu(), -0.005]; } | |||
], { | |||
strokeColor: '#0000ff', | |||
strokeWidth: 2, | |||
dash: 1 | |||
}); | |||
var muPlusSigmaLine = brd.create('segment', [ | |||
function() { return [getMu() + getSigma(), 0]; }, | |||
function() { return [getMu() + getSigma(), -0.015]; } | |||
], { | |||
strokeColor: '#007700', | |||
strokeWidth: 2, | |||
dash: 1 | |||
}); | |||
var muMinusSigmaLine = brd.create('segment', [ | |||
function() { return [getMu() - getSigma(), 0]; }, | |||
function() { return [getMu() - getSigma(), -0.015]; } | |||
], { | |||
strokeColor: '#007700', | |||
strokeWidth: 2, | |||
dash: 1 | |||
}); | |||
var muPlus2SigmaLine = brd.create('segment', [ | |||
function() { return [getMu() + 2 * getSigma(), 0]; }, | |||
function() { return [getMu() + 2 * getSigma(), -0.025]; } | |||
], { | |||
strokeColor: '#aa5500', | |||
strokeWidth: 2, | |||
dash: 1 | |||
}); | |||
var muMinus2SigmaLine = brd.create('segment', [ | |||
function() { return [getMu() - 2 * getSigma(), 0]; }, | |||
function() { return [getMu() - 2 * getSigma(), -0.025]; } | |||
], { | |||
strokeColor: '#aa5500', | |||
strokeWidth: 2, | |||
dash: 1 | |||
}); | |||
var muPlus3SigmaLine = brd.create('segment', [ | |||
function() { return [getMu() + 3 * getSigma(), 0]; }, | |||
function() { return [getMu() + 3 * getSigma(), -0.035]; } | |||
], { | |||
strokeColor: '#aa0000', | |||
strokeWidth: 2, | |||
dash: 1 | |||
}); | |||
var muMinus3SigmaLine = brd.create('segment', [ | |||
function() { return [getMu() - 3 * getSigma(), 0]; }, | |||
function() { return [getMu() - 3 * getSigma(), -0.035]; } | |||
], { | |||
strokeColor: '#aa0000', | |||
strokeWidth: 2, | |||
dash: 1 | |||
}); | |||
// Beschriftungen für die Sigmaregeln (nach unten versetzt) | |||
brd.create('text', [function() { return getMu(); }, -0.0075, 'μ'], { | |||
anchorX: 'middle', | |||
fontSize: 12, | |||
strokeColor: '#0000ff' | |||
}); | |||
brd.create('text', [function() { return getMu() + getSigma(); }, -0.0175, 'μ+σ'], { | |||
anchorX: 'middle', | |||
fontSize: 12, | |||
strokeColor: '#007700' | |||
}); | |||
brd.create('text', [function() { return getMu() - getSigma(); }, -0.0175, 'μ-σ'], { | |||
anchorX: 'middle', | |||
fontSize: 12, | |||
strokeColor: '#007700' | |||
}); | |||
brd.create('text', [function() { return getMu() + 2 * getSigma(); }, -0.0275, 'μ+2σ'], { | |||
anchorX: 'middle', | |||
fontSize: 12, | |||
strokeColor: '#aa5500' | |||
}); | |||
brd.create('text', [function() { return getMu() - 2 * getSigma(); }, -0.0275, 'μ-2σ'], { | |||
anchorX: 'middle', | |||
fontSize: 12, | |||
strokeColor: '#aa5500' | |||
}); | |||
brd.create('text', [function() { return getMu() + 3 * getSigma(); }, -0.0375, 'μ+3σ'], { | |||
anchorX: 'middle', | |||
fontSize: 12, | |||
strokeColor: '#aa0000' | |||
}); | |||
brd.create('text', [function() { return getMu() - 3 * getSigma(); }, -0.0375, 'μ-3σ'], { | |||
anchorX: 'middle', | |||
fontSize: 12, | |||
strokeColor: '#aa0000' | |||
}); | |||
// Anzeige von P(X=k), μ und σ (oben rechts) | |||
brd.create('text', [30, 0.15, function() { | |||
var n = Math.round(nSlider.Value()); | |||
var p = pSlider.Value(); | |||
var k = Math.round(kSlider.Value()); | |||
return 'P(X = ' + k + ') = ' + binomProb(n, k, p).toFixed(6); | |||
}], { | |||
anchorX: 'left', | |||
fontSize: 12, | |||
fixed: true | |||
}); | |||
brd.create('text', [30, 0.14, function() { return 'μ = n·p=' + getMu().toFixed(2); }], { | |||
anchorX: 'left', | |||
fontSize: 12, | |||
fixed: true | |||
}); | |||
brd.create('text', [30, 0.13, function() { return 'σ = √(n·p·(1-p))=' + getSigma().toFixed(2); }], { | |||
anchorX: 'left', | |||
fontSize: 12, | |||
fixed: true | |||
}); | |||
brd.create('text', [30, 0.12, function() { return 'P(|X-' + getMu().toFixed(2) + '|\u2264' + getSigma().toFixed(2) + ') \u2248 0,683';}], { | |||
anchorX: 'left', | |||
fontSize: 12, | |||
fixed: true, | |||
strokeColor: '#007700' | |||
}); | |||
brd.create('text', [30, 0.11, function() { return 'P(|X-' + getMu().toFixed(2) + '|\u2264 2·' + getSigma().toFixed(2) + ') \u2248 0,955';}], { | |||
anchorX: 'left', | |||
fontSize: 12, | |||
fixed: true, | |||
strokeColor: '#aa5500' | |||
}); | |||
brd.create('text', [30, 0.1, function() { return 'P(|X-' + getMu().toFixed(2) + '|\u2264 3·' + getSigma().toFixed(2) + ') \u2248 0,997';}], { | |||
anchorX: 'left', | |||
fontSize: 12, | |||
fixed: true, | |||
strokeColor: '#aa0000' | |||
}); | |||
</script> | |||
</html> | |||
<html><iframe width="280" height="157.5" src="https://www.youtube.com/embed/Lc_R0vBSKHw?si=V72WfOUjhQRQlrN9" title="YouTube video player" frameborder="0" allow="accelerometer; autoplay; clipboard-write; encrypted-media; gyroscope; picture-in-picture; web-share" allowfullscreen></iframe></html> | <html><iframe width="280" height="157.5" src="https://www.youtube.com/embed/Lc_R0vBSKHw?si=V72WfOUjhQRQlrN9" title="YouTube video player" frameborder="0" allow="accelerometer; autoplay; clipboard-write; encrypted-media; gyroscope; picture-in-picture; web-share" allowfullscreen></iframe></html> | ||
[[Kategorie:Wahrscheinlichkeitsrechnung]] | |||
[[Kategorie:FHR_WuV_Mathe]] | |||
[[Kategorie:AHR_WuV_Mathe_GK]] | |||
Aktuelle Version vom 31. August 2025, 11:24 Uhr
Die Wahrscheinlichkeitsverteilung eines Zufallsexperiments wird durch ein Histogramm visualisiert.
Definition
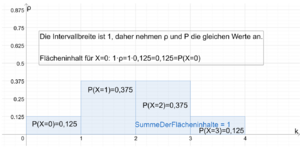
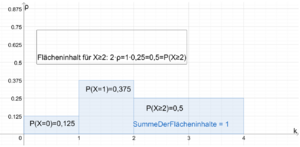
Es sei die Wahrscheinlichkeitsverteilung zu einem Zufallsexperiment gegeben. Ein Säulendiagramm, bei dem der Flächeninhalt einer Säule die Wahrscheinlichkeit des dazugehörigen Ergebnisses ist, heißt Histogramm. Die Höhe einer Säule wird als Wahrscheinlichkeitsdichte [math]\displaystyle{ \rho }[/math] (roh) bezeichnet. Die Breite einer Säule gibt an, wie viele Ergebnisse durch die Säule repräsentiert werden. Somit ergibt die Wahrscheinlichkeitsdichte [math]\displaystyle{ \rho_K }[/math] multipliziert mit der Breite [math]\displaystyle{ b_K }[/math] die Wahrscheinlichkeit des Ereignisses [math]\displaystyle{ K }[/math]; [math]\displaystyle{ P(K)=\rho_K\cdot b_K }[/math].
Beispiel
Histogramm zum dreifachen Münzwurf
Die folgenden beiden Histogramme visualisieren die Wahrscheinlichkeiten zum Zufallsexperiment des dreifachen Münzwurfs.
Histogramm der Binomialverteilung
Die folgende interaktive Grafik zeigt das Histogramm der [math]\displaystyle{ B(n;p;k) }[/math]-verteilten Zufallsvariablen [math]\displaystyle{ X }[/math] sowie eine grafische Darstellung der Sigmaregeln. Dabei gilt
- [math]\displaystyle{ P\left(\mu-\sigma\leq X\leq \mu+\sigma\right)=P(|X-\mu|\leq \sigma)\approx0,683 }[/math], d. h. die Werte der Zufallsvariablen [math]\displaystyle{ X }[/math] liegen mit einer Wahrscheinlichkeit von ungefähr 68,3 % im Intervall [math]\displaystyle{ [\mu-\sigma;\mu+\sigma] }[/math].
- [math]\displaystyle{ P\left(\mu-2\sigma\leq X\leq \mu+2\sigma\right)=P(|X-\mu|\leq 2\sigma)\approx0,955 }[/math], d. h. die Werte der Zufallsvariablen [math]\displaystyle{ X }[/math] liegen mit einer Wahrscheinlichkeit von ungefähr 95,5 % im Intervall [math]\displaystyle{ [\mu-2\sigma;\mu+2\sigma] }[/math].
- [math]\displaystyle{ P\left(\mu-3\sigma\leq X\leq\mu+3\sigma\right)=P(|X-\mu|\leq 3\sigma)\approx0,997 }[/math] mit [math]\displaystyle{ \sigma \geq 3 }[/math] , d. h. die Werte der Zufallsvariablen [math]\displaystyle{ X }[/math] liegen mit einer Wahrscheinlichkeit von ungefähr 99,7 % im Intervall [math]\displaystyle{ [\mu-3\sigma;\mu+3\sigma] }[/math]. Die Wahrscheinlichkeit [math]\displaystyle{ P(X \leq k) }[/math] wird berechnet, indem die Höhen aller Säulen, die zu Werten gehören, die kleiner oder gleich [math]\displaystyle{ k }[/math] sind, addiert werden.

