Histogramm: Unterschied zwischen den Versionen
| Zeile 15: | Zeile 15: | ||
</gallery> | </gallery> | ||
===Histogramm der Binomialverteilung=== | ===Histogramm der Binomialverteilung=== | ||
html> | |||
<head> | <head> | ||
<script type="text/javascript" src="https://cdnjs.cloudflare.com/ajax/libs/jsxgraph/1.4.6/jsxgraphcore.js"></script> | <script type="text/javascript" src="https://cdnjs.cloudflare.com/ajax/libs/jsxgraph/1.4.6/jsxgraphcore.js"></script> | ||
| Zeile 21: | Zeile 21: | ||
</head> | </head> | ||
<body> | <body> | ||
<div id=" | <div id="box2" style="width: 90vw; max-width: 400px; height: 60vw; max-height: 300px; margin-top:20px;"></div> | ||
<script type="text/javascript"> | <script type="text/javascript"> | ||
JXG.Options.text.useMathJax = true; | |||
// JSXGraph-Board erstellen | |||
var board = JXG.JSXGraph.initBoard('box2', { | |||
boundingbox: [-5, 5, 10, -5], // Angepasste Boundingbox für die Skalierung | |||
axis: true, | |||
showCopyright: false, | |||
showNavigation: true, | |||
grid: true, // Gitternetz aktivieren | |||
defaultAxes: { | |||
x: { | |||
withLabel: true, | |||
name: '\\[t\\]', | |||
label: { | |||
position: 'rt', | |||
offset: [-5, 20], | |||
fontSize: 14, | |||
anchorX: 'right' | |||
}, | |||
ticks: { | |||
ticksDistance: 1, | |||
minorTicks: 0 | |||
} | |||
}, | |||
y: { | |||
withLabel: true, | |||
name: '\\[f(t)\\]', | |||
label: { | |||
position: 'rt', | |||
offset: [5, 20], | |||
fontSize: 14, | |||
anchorY: 'right' | |||
}, | |||
ticks: { | |||
ticksDistance: 1, | |||
minorTicks: 0 | |||
} | |||
} | } | ||
} | } | ||
}); | |||
// Funktion erstellen | |||
var c1 = board.create('functiongraph', [function(t) { | |||
return (Math.pow(t, 5) / 24 - Math.pow(t, 3) / 2 + t); | |||
}]); | |||
// Integral erstellen | |||
var i1 = board.create('integral', [ | |||
[-2.0, 2.0], c1 | |||
var | |||
[ | |||
], { | ], { | ||
withLabel: true, | |||
label: { | |||
fontSize: 14, | |||
offset: [0, 50], | |||
digits: 4, | |||
visible: | intl: { | ||
enabled: false, | |||
options: {} | |||
} | |||
}, | |||
baseLeft: { // Start point | |||
visible: true, | |||
fixed: false, | |||
withLabel: true, | |||
name: 'a' | |||
}, | |||
baseRight: { // End point | |||
visible: true, | |||
fixed: false, | |||
withLabel: true, | |||
name: 'b' | |||
} | } | ||
}); | }); | ||
// Integral-Label anpassen | |||
i1.label.setText(() => { | |||
const a = i1.baseLeft.X().toFixed(2); // Untere Grenze | |||
const b = i1.baseRight.X().toFixed(2); // Obere Grenze | |||
const value = i1.Value().toFixed(4); // Wert des Integrals | |||
return `\\[\\int_{${a}}^{${b}} f(t) \\, dt = ${value}\\]`; | |||
}); | |||
// Beschriftung der Funktion mit f | |||
board.create('text', [3.5, 3, '\\[f\\]'], { | |||
fontSize: 14, | |||
fixed: true, | |||
anchorX: 'left', | |||
anchorY: 'bottom', | |||
color: 'blue' | |||
}); | |||
</script> | </script> | ||
</body> | </body> | ||
Version vom 31. August 2025, 10:54 Uhr
Die Wahrscheinlichkeitsverteilung eines Zufallsexperiments wird durch ein Histogramm visualisiert.
Definition
Es sei die Wahrscheinlichkeitsverteilung zu einem Zufallsexperiment gegeben. Ein Säulendiagramm, bei dem der Flächeninhalt einer Säule die Wahrscheinlichkeit des dazugehörigen Ergebnisses ist, heißt Histogramm. Die Höhe einer Säule wird als Wahrscheinlichkeitsdichte [math]\displaystyle{ \rho }[/math] (roh) bezeichnet. Die Breite einer Säule gibt an, wie viele Ergebnisse durch die Säule repräsentiert werden. Somit ergibt die Wahrscheinlichkeitsdichte [math]\displaystyle{ \rho_K }[/math] multipliziert mit der Breite [math]\displaystyle{ b_K }[/math] die Wahrscheinlichkeit des Ereignisses [math]\displaystyle{ K }[/math]; [math]\displaystyle{ P(K)=\rho_K\cdot b_K }[/math].
Beispiel
Histogramm zum dreifachen Münzwurf
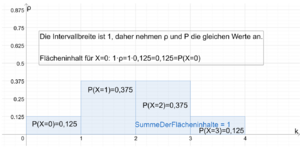
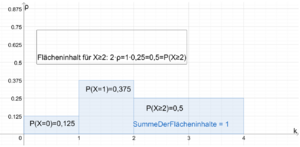
Die folgenden beiden Histogramme visualisieren die Wahrscheinlichkeiten zum Zufallsexperiment des dreifachen Münzwurfs.
Histogramm der Binomialverteilung
html> <head>
<script type="text/javascript" src="https://cdnjs.cloudflare.com/ajax/libs/jsxgraph/1.4.6/jsxgraphcore.js"></script>
</head> <body>
   <script type="text/javascript">
       JXG.Options.text.useMathJax = true;
       // JSXGraph-Board erstellen
       var board = JXG.JSXGraph.initBoard('box2', {
           boundingbox: [-5, 5, 10, -5], // Angepasste Boundingbox für die Skalierung
           axis: true,
           showCopyright: false,
           showNavigation: true,
           grid: true, // Gitternetz aktivieren
           defaultAxes: {
               x: {
                   withLabel: true,
                   name: '\\[t\\]',
                   label: {
                       position: 'rt',
                       offset: [-5, 20],
                       fontSize: 14,
                       anchorX: 'right'
                   },
                   ticks: {
                       ticksDistance: 1,
                       minorTicks: 0
                   }
               },
               y: {
                   withLabel: true,
                   name: '\\[f(t)\\]',
                   label: {
                       position: 'rt',
                       offset: [5, 20],
                       fontSize: 14,
                       anchorY: 'right'
                   },
                   ticks: {
                       ticksDistance: 1,
                       minorTicks: 0
                   }
               }
           }
       });
       // Funktion erstellen
       var c1 = board.create('functiongraph', [function(t) {
           return (Math.pow(t, 5) / 24 - Math.pow(t, 3) / 2 + t);
       }]);
       // Integral erstellen
       var i1 = board.create('integral', [
           [-2.0, 2.0], c1
       ], {
           withLabel: true,
           label: {
               fontSize: 14,
               offset: [0, 50],
               digits: 4,
               intl: {
                   enabled: false,
                   options: {}
               }
           },
           baseLeft: {    // Start point
               visible: true,
               fixed: false,
               withLabel: true,
               name: 'a'
           },
           baseRight: {    // End point
               visible: true,
               fixed: false,
               withLabel: true,
               name: 'b'
           }
       });
       // Integral-Label anpassen
       i1.label.setText(() => {
           const a = i1.baseLeft.X().toFixed(2); // Untere Grenze
           const b = i1.baseRight.X().toFixed(2); // Obere Grenze
           const value = i1.Value().toFixed(4); // Wert des Integrals
           return `\\[\\int_{${a}}^{${b}} f(t) \\, dt = ${value}\\]`;
       });
       // Beschriftung der Funktion mit f
       board.create('text', [3.5, 3, '\\[f\\]'], {
           fontSize: 14,
           fixed: true,
           anchorX: 'left',
           anchorY: 'bottom',
           color: 'blue'
       });
   </script>
</body> </html>

