Hauptsatz der Differential- und Integralrechnung: Unterschied zwischen den Versionen
| Zeile 34: | Zeile 34: | ||
* Liegt der Graph von <math>f</math> sowohl unterhalb als auch oberhalb der x-Achse, ist das bestimmte Integral die Differenz aus dem oberen Flächeninhalt und dem unteren Flächeninhalt. | * Liegt der Graph von <math>f</math> sowohl unterhalb als auch oberhalb der x-Achse, ist das bestimmte Integral die Differenz aus dem oberen Flächeninhalt und dem unteren Flächeninhalt. | ||
<jsxgraph> | |||
var brd, k; | |||
JXG.Options.text.useMathJax = true; | |||
brd = JXG.JSXGraph.initBoard('jxgbox', {boundingbox:[-5,20,5,-5], axis:true, showNavigation:true, showCopyright:true}); | |||
k = brd.create('slider',[[-4,-2],[3,-2],[-5,1,5]],{name:'n', snapWidth:1}); | |||
brd.create('functiongraph', [function(t) {return JXG.Math.pow(Math.E,t*k.Value());}],{strokeColor:'#ff0000'}); | |||
brd.create('text',[-4,7, | |||
function() { | |||
return '\\[f(x) = e^{' + k.Value() + 'x}\\]'; | |||
}], {fontSize:24}); | |||
</jsxgraph> | </jsxgraph> | ||
Version vom 13. Februar 2025, 07:37 Uhr
Mit Hilfe des Hauptsatzes der Differential- und Integralrechnung werden Flächeninhalte zwischen dem Graphen einer Funktion der x-Achse berechnet.
Flächeninhaltsfunktion und Stammfunktion
Der Flächeninhalt zwischen dem Graphen einer Funktion [math]\displaystyle{ f }[/math] und der x-Achse im Intervall [math]\displaystyle{ [0;x] }[/math] wird durch den Funktionswert einer Flächeninhaltsfunktion [math]\displaystyle{ A }[/math] ermittelt.
Es sei [math]\displaystyle{ F }[/math] die Stammfunktion zu einer Funktion [math]\displaystyle{ f }[/math] mit der Konstanten [math]\displaystyle{ C=0 }[/math], dann ist [math]\displaystyle{ F }[/math] die Flächeninhaltsfunktion zu [math]\displaystyle{ f }[/math].
Bestimmtes Integral
Das bestimmte Integral einer stetigen Funktion [math]\displaystyle{ f }[/math] auf dem Intervall [math]\displaystyle{ [a; b] }[/math] ist durch
- [math]\displaystyle{ \int_a^b f(x) dx }[/math]
gegeben.
Für auf den Intervallen [math]\displaystyle{ [a;b] }[/math] und [math]\displaystyle{ [b;c] }[/math] stetige Funktionen [math]\displaystyle{ f, ~g }[/math] gelten die folgenden Rechenregeln:
Faktorregel
- [math]\displaystyle{ \int_a^b c \cdot f(x) dx=c \cdot \int_a^b f(x) dx }[/math]
Summenregel
- [math]\displaystyle{ \int_a^b (f(x)+g(x)) dx=\int_a^b f(x)dx+\int_a^bg(x) dx }[/math]
Intervalladditivität
- [math]\displaystyle{ \int_a^c f(x) dx=\int_a^b f(x) dx+\int_b^c f(x) dx }[/math]
Vertauschen der Integrationsgrenzen
- [math]\displaystyle{ \int_a^b f(x) dx=-\int_b^a f(x) dx }[/math]
Definition
Falls [math]\displaystyle{ F }[/math] eine Stammfunktion von [math]\displaystyle{ f }[/math] ist, so wird das bestimmte Integral von [math]\displaystyle{ f }[/math] auf dem Intervall [math]\displaystyle{ [a;b] }[/math] durch die Gleichung
- [math]\displaystyle{ \int_a^b f(x) \, dx = F(b) - F(a) }[/math]
berechnet.
Hierbei bezeichnet [math]\displaystyle{ a }[/math] die untere und [math]\displaystyle{ b }[/math] die obere Grenze des Integrals. Das bestimmte Integral gibt den orientierten Flächeninhalt an, das heißt:
- Liegt der Graph von [math]\displaystyle{ f }[/math] oberhalb der x-Achse, ist das bestimmte Integral positiv.
- Liegt der Graph von [math]\displaystyle{ f }[/math] unterhalb der x-Achse, ist das bestimmte Integral negativ.
- Liegt der Graph von [math]\displaystyle{ f }[/math] sowohl unterhalb als auch oberhalb der x-Achse, ist das bestimmte Integral die Differenz aus dem oberen Flächeninhalt und dem unteren Flächeninhalt.
<jsxgraph> var brd, k; JXG.Options.text.useMathJax = true; brd = JXG.JSXGraph.initBoard('jxgbox', {boundingbox:[-5,20,5,-5], axis:true, showNavigation:true, showCopyright:true}); k = brd.create('slider',[[-4,-2],[3,-2],[-5,1,5]],{name:'n', snapWidth:1}); brd.create('functiongraph', [function(t) {return JXG.Math.pow(Math.E,t*k.Value());}],{strokeColor:'#ff0000'}); brd.create('text',[-4,7,
 function() {
   return '\\[f(x) = e^{' + k.Value() + 'x}\\]';
 }], {fontSize:24});
</jsxgraph>
Integralfunktion
Es sei [math]\displaystyle{ f }[/math] eine auf dem Intervall [math]\displaystyle{ [a;b] }[/math] stetige Funktion, dann ist
- [math]\displaystyle{ I_a(x)=\int_a^x f(t)d(t) }[/math]
die dazugehörige Integralfunktion.
Flächen zwischen Funktionsgraphen ermitteln
Es seien [math]\displaystyle{ f, ~g }[/math] auf dem Intervall [math]\displaystyle{ [a;b] }[/math] stetige Funktionen. Die Fläche zwischen den Graphen von [math]\displaystyle{ f, ~g }[/math] wird wie folgt ermittelt:
- Schnittstellen [math]\displaystyle{ x_{S_1},...,x_{S_n} }[/math] mit [math]\displaystyle{ n \in \mathbb{N} }[/math] der Graphen von [math]\displaystyle{ f, ~g }[/math] ermitteln.
- Stammfunktionen [math]\displaystyle{ F,~G }[/math] ermitteln
- [math]\displaystyle{ A=\int_{x_{S_1}}^{x_{S_2}}(f(x)-g(x))dx|+\int_{x_{S_1}}^{x_{S_2}}(f(x)-g(x))dx|+...+\int_{x_{S_{n-1}}}^{x_{S_n}}(f(x)-g(x))dx }[/math] berechnen. Der Betrag von [math]\displaystyle{ A }[/math] ist der gesuchte Flächeninhalt.
Beispiele
Flächeninhalt ermitteln
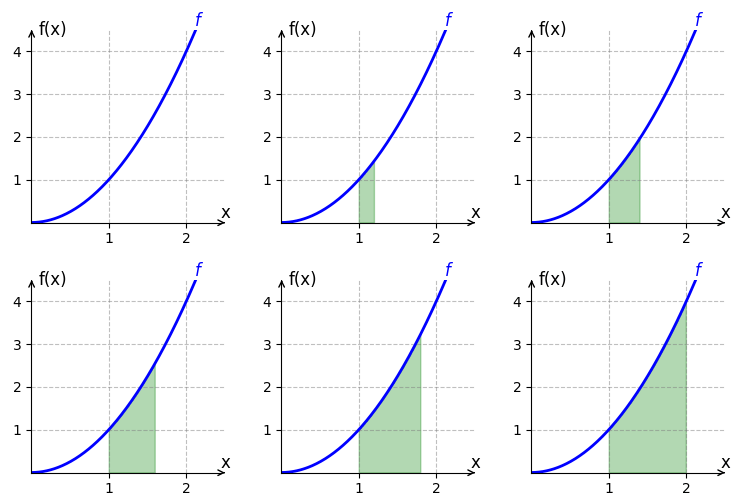
Wir berechnen das bestimmte Integral von [math]\displaystyle{ f(x) = x^2 }[/math] auf dem Intervall [math]\displaystyle{ [1;2] }[/math]. Eine Stammfunktion von [math]\displaystyle{ f }[/math] ist [math]\displaystyle{ F(x) = \frac{x^3}{3} }[/math]. Das bestimmte Integral auf dem Intervall [1;2] wird durch
- [math]\displaystyle{ \int_1^2 x^2 ~dx = F(2) - F(1) }[/math]
- [math]\displaystyle{ = \frac{2^3}{3} - \frac{1^3}{3} = \frac{8}{3} - \frac{1}{3} = \frac{7}{3} }[/math]
berechnet. Der Graph von [math]\displaystyle{ f }[/math] verläuft auf dem Intervall [math]\displaystyle{ [1;2] }[/math] oberhalb der x-Achse. Der Flächeninhal beträgt somit [math]\displaystyle{ \frac{7}{3} }[/math] Einheiten und ist im rechten Bild grün eingezeichnet.

Orientierten Flächeninhalt ermitteln
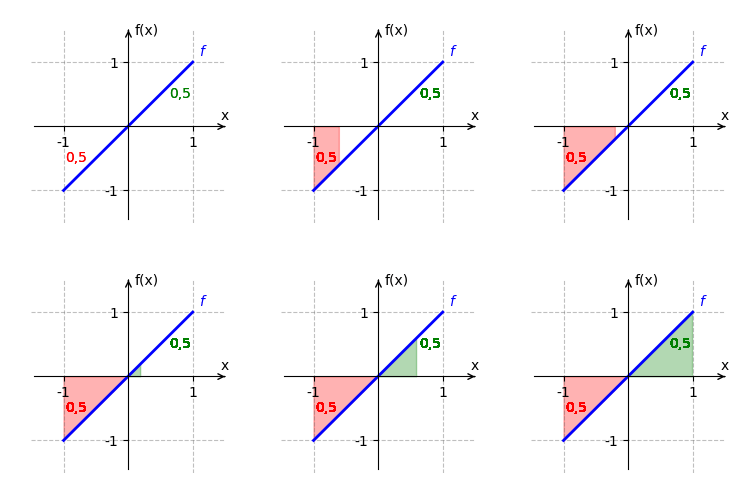
Wir betrachten [math]\displaystyle{ f(x) = x }[/math] auf dem Intervall [math]\displaystyle{ [-1;1] }[/math]. Eine Stammfunktion von [math]\displaystyle{ f }[/math] ist [math]\displaystyle{ F(x) = \frac{x^2}{2} }[/math]. Das bestimmte Integral ist:
- [math]\displaystyle{ \int_{-1}^1 x \, dx = F(1) - F(-1) }[/math]
- [math]\displaystyle{ = \frac{1^2}{2} - \frac{(-1)^2}{2} = \frac{1}{2} - \frac{1}{2} = 0 }[/math].
Der orientierte Flächeninhalt beträgt [math]\displaystyle{ 0 }[/math], da sich die positiven und negativen Flächeninhalte genau ausgleichen.

Integralfunktion ermitteln
Gegeben sei [math]\displaystyle{ f(x) = 3x }[/math] und [math]\displaystyle{ a = 0 }[/math]. Die Integralfunktion ist:
- [math]\displaystyle{ I_0(x) = \int_0^x 3t \, dt }[/math].
Eine Stammfunktion von [math]\displaystyle{ 3t }[/math] ist [math]\displaystyle{ \frac{3t^2}{2} }[/math], also gilt
- [math]\displaystyle{ I_0(x) = \frac{3x^2}{2} - \frac{3 \cdot 0^2}{2} = \frac{3x^2}{2} }[/math].
Flächeninhalt zwischen den Graphen von zwei Funktionen ermitteln
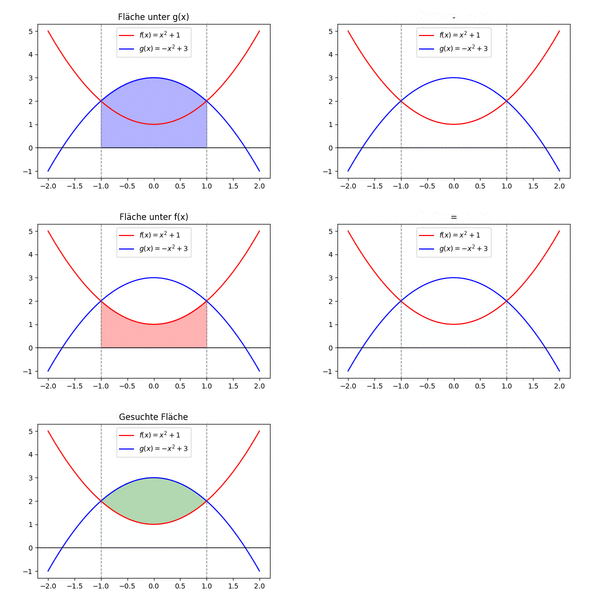
Wir betrachten die Funktionen [math]\displaystyle{ f(x)=x^2+1 }[/math] und [math]\displaystyle{ g(x)=-x^2+3 }[/math] und ermitteln die Fläche zwischen den Graphen der Funktionen.
1. Schnittstellen von [math]\displaystyle{ g,~f }[/math] ermitteln
- [math]\displaystyle{ f(x)=g(x) }[/math]
- [math]\displaystyle{ x^2+1=-x^2+3 }[/math]
- [math]\displaystyle{ 2 \cdot x^2=2 }[/math]
- [math]\displaystyle{ x^2=1 }[/math]
- [math]\displaystyle{ x=\pm \sqrt{1} }[/math]
- [math]\displaystyle{ x=\pm 1 }[/math]
2. Stammfunktionen ermitteln
- [math]\displaystyle{ F(x)=\frac{1}{3}x^3+x }[/math]
- [math]\displaystyle{ G(x)=-\frac{1}{3}x^3+3x }[/math]
3. Flächeninhalt ermitteln
- [math]\displaystyle{ \int_{-1}^{1}(f(x)-g(x))dx=F(1)-G(1)-(F(-1)-G(-1)) }[/math]
- [math]\displaystyle{ =\frac{1}{3} \cdot 1^3+1-(-\frac{1}{3}\cdot 1^3+3 \cdot 1) }[/math]
- [math]\displaystyle{ -(\frac{1}{3} \cdot (-1)^3+(-1)-(-\frac{1}{3}\cdot (-1)^3+3 \cdot (-1))) }[/math]
- [math]\displaystyle{ =-\frac{8}{3} }[/math]
Der gesuchte Flächeninhalt ist der Betrag der Zahl und beträgt [math]\displaystyle{ \frac{8}{3} }[/math].
