Exponentialfunktion
Exponentialfunktionen haben die Form [math]\displaystyle{ f(x)=c \cdot a^x }[/math] und spielen insbesondere in Wachstumsprozessen eine wichtige Rolle. Dazu gehören der Zinseszinseffekt, der Bevölkerungswachstum oder die Ausbreitung von Infektionskrankheiten.
Definition
Eine Funktion [math]\displaystyle{ f:\mathbb{D}_f \rightarrow \mathbb{R} }[/math] der Form [math]\displaystyle{ f(x)=c \cdot a^x }[/math] mit [math]\displaystyle{ a,~c \in \mathbb{R},~a \geq 0,~a \neq 1 }[/math] heißt allgemeine Exponentialfunktion zur Basis a. [math]\displaystyle{ c }[/math] ist der y-Achsenabschnitt.
Ableitung
Für die Ableitung der allgemeinen Exponentialfunktion zur Basis [math]\displaystyle{ a }[/math] der Form [math]\displaystyle{ f(x)=a^x }[/math] gilt:
[math]\displaystyle{ f'(t)=\lim \limits_{h \to 0} \frac{f(t+h)-f(t)}{h}=\lim \limits_{h \to 0} \frac{a^{t+h}-a^{t}}{h}=\lim \limits_{h \to 0} \frac{a^t \cdot a^h-a^{t}}{h}=(\lim \limits_{h \to 0} \frac{a^h-1}{h}) a^t = c \cdot a^t }[/math] mit [math]\displaystyle{ c=\lim \limits_{h \to 0} \frac{a^h-1}{h} }[/math].
Die Ableitung der Exponentialfunktion ist also wieder eine Exponentialfunktion mit der Basis [math]\displaystyle{ a }[/math] und dem y-Achsenabschnitt [math]\displaystyle{ c=\lim \limits_{h \to 0} \frac{a^h-1}{h} }[/math]. Mit Hilfe der Taylor-Reihe lässt sich der Grenzwert ermitteln: [math]\displaystyle{ \lim \limits_{h \to 0} \frac{a^h-1}{h}=ln(a) }[/math]
Also gilt [math]\displaystyle{ f'(x)=ln(a)a^x }[/math].
Verlauf der Graphen von Exponentialfunktion
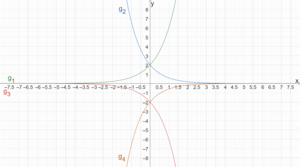
Gegeben sei eine allgemeine Exponentialfunktion zur Basis a.
- Gilt [math]\displaystyle{ c\gt 0 }[/math] und [math]\displaystyle{ a\gt 1 }[/math] ist der Graph streng monoton steigend und eine Linkskurve. Wir nennen das positives Wachstum.
- Gilt [math]\displaystyle{ c\gt 0 }[/math] und [math]\displaystyle{ 0\lt a\lt 1 }[/math] ist der Graph streng monoton fallend und eine Linkskurve. Wir nennen das negatives Wachstum.
- Gilt [math]\displaystyle{ c\lt 0 }[/math] und [math]\displaystyle{ 0\lt a\lt 1 }[/math] ist der Graph streng monoton steigend und eine Rechtskurve.
- Gilt [math]\displaystyle{ c\lt 0 }[/math] und [math]\displaystyle{ a\gt 1 }[/math] ist der Graph streng monoton fallend und eine Rechtskurve.
Spiegelbildliche Exponentialfunktionen
Die Exponentialfunktionen [math]\displaystyle{ f_1(x)=c \cdot a^x }[/math] und [math]\displaystyle{ f_2(x)=c \cdot (\frac{1}{a})^x }[/math] mit [math]\displaystyle{ a,~c \in \mathbb{R},~a \geq 0,~a \neq 1 }[/math] sind spiegelbildlich bezüglich der y-Achse zueinander.
Erweiterte Form
Eine Funktion [math]\displaystyle{ f:\mathbb{D}_f \rightarrow \mathbb{R} }[/math] der Form [math]\displaystyle{ f(x)=c \cdot a^x+d }[/math] mit [math]\displaystyle{ a,~c,~d \in \mathbb{R},~a \geq 0,~a \neq 1 }[/math] heißt erweiterte Exponentialfunktion. Die Gerade [math]\displaystyle{ y=d }[/math] bezeichnen wir als Asymptote. Der y-Achsenabschnitt ist [math]\displaystyle{ c+d }[/math].
Nullstellen
Eine allgemeine Exponentialfunktion zur Basis [math]\displaystyle{ a }[/math] der Form [math]\displaystyle{ f(x)=c \cdot a^x }[/math] mit [math]\displaystyle{ a,~c \in \mathbb{R},~a \geq 0,~a \neq 1 }[/math] hat keine Nullstellen.
Die Nullstelle der erweiterten Form existiert, falls [math]\displaystyle{ \frac{d}{c}\lt 0 }[/math] sowie [math]\displaystyle{ a\gt 0 }[/math] gilt und wird durch
[math]\displaystyle{ f(x)=0 }[/math]
[math]\displaystyle{ c \cdot a^x+d=0 }[/math]
[math]\displaystyle{ c \cdot a^x=-d }[/math]
[math]\displaystyle{ a^x=-\frac{d}{c} }[/math]
[math]\displaystyle{ x=log_a(-\frac{d}{c})=\frac{log(-\frac{d}{c})}{log(a)} }[/math]
ermittelt.
Beispiele
Exponentialfunktionen mit verschiedenen Basen
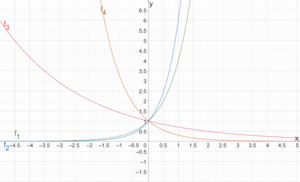
Wir betrachten die Exponentialfunktionen [math]\displaystyle{ f_1(x)=4^x,~f_2(x)=6^x,~f_3(x)=0,7^x,~f_4(x)=0,3^x }[/math]. Die Basis für die Funktion [math]\displaystyle{ f_1 }[/math] ist [math]\displaystyle{ a=4 }[/math], für jede der Funktionen gilt [math]\displaystyle{ c=1 }[/math].
Der y-Achsenabschnitt der Funktion [math]\displaystyle{ f_1 }[/math] wird durch [math]\displaystyle{ f_1(0)=4^0=1 }[/math] berechnet. Der Schnittpunkt mit der y-Achse beträgt [math]\displaystyle{ S_y(0|1) }[/math].
Die Graphen der Funktionen [math]\displaystyle{ f_1 }[/math] und [math]\displaystyle{ f_2 }[/math] zeigen positives Wachstum. Die Graphen der Funktionen [math]\displaystyle{ f_3 }[/math] und [math]\displaystyle{ f_4 }[/math] zeigen negatives Wachstum.
Exponentialfunktionen mit verschiedenen Faktoren
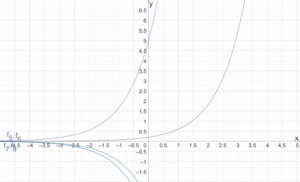
Wir betrachten die Exponentialfunktionen [math]\displaystyle{ f_5(x)=5 \cdot 3^x,~f_6(x)=0,2\cdot 3^x,~f_7(x)=(-3)\cdot 3^x,~f_8(x)=(-4)\cdot 3^x }[/math]. Für die y-Achsenabschnitte gilt [math]\displaystyle{ f_5(0)=5 \cdot 3^0=5,~f_6(0)=0,2\cdot 3^0=0,2,~f_7(x)=(-3)\cdot 3^0=-3,~f_8(x)=(-4)\cdot 3^0=-4 }[/math]. Die Schnittpunkte mit der y-Achse lassen sich in den Graphen ablesen. Beispielsweise ist für [math]\displaystyle{ f_5 }[/math] der Schnittpunkt mit der y-Achse [math]\displaystyle{ S_y(0|5) }[/math].
Die Nullstelle von [math]\displaystyle{ f_5 }[/math] wird durch
[math]\displaystyle{ f_5(x)=0 }[/math]
[math]\displaystyle{ 5 \cdot 3^x=0 }[/math]
berechnet. Es [math]\displaystyle{ 5 \cdot 3^x \neq 0 }[/math] für jedes [math]\displaystyle{ x \in \mathbb{R} }[/math]. Daher hat [math]\displaystyle{ f_5 }[/math] keine Nullstellen.
Spiegelbildliche Exponentialfunktionen
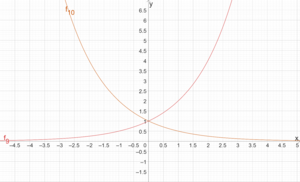
Die Graphen der Funktionen [math]\displaystyle{ f_9(x)=2^x }[/math] und [math]\displaystyle{ f_{10}(x)=(\frac{1}{2})^x }[/math] sind spiegelbildlich bezüglich der y-Achse.
Beschränkter Wachstumsprozess
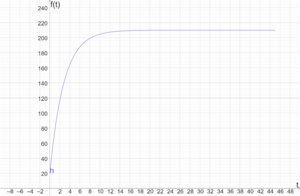
Wir backen ein schmackhaftes Zwiebelbrot bei 210 °C und messen die Temperatur des Brotes im Ofen. Die Raumtemperatur beträgt 20 °C. Wir modellieren im Folgenden den 45 minütigen Backprozess durch eine erweiterte Exponentialfunktion der Form [math]\displaystyle{ h(t)=c \cdot a^t+d }[/math]. Dabei ist [math]\displaystyle{ t }[/math] in Minuten und [math]\displaystyle{ h(t) }[/math] in °C angegeben. Aufgrund der Backtemperatur von 210 °C, kann das Brot nicht wärmer als 210 °C werden, daher gilt [math]\displaystyle{ d=210 }[/math].
Da der Backprozess 45 Minuten andauert, ist der Definitionsbereich [math]\displaystyle{ \mathbb{D}_h=[0;45] }[/math]. Temperaturmessungen des Zwiebelbrotes liefern, dass zum Zeitpunkt [math]\displaystyle{ t=0 }[/math] die Temperatur 20 °C und zum Zeitpunkt [math]\displaystyle{ t=1 }[/math] die Temperatur 77 °C beträgt. Damit gilt
[math]\displaystyle{ h(0)=c\cdot a^0+210 }[/math]
[math]\displaystyle{ 20=c+210 }[/math]
[math]\displaystyle{ -190=c }[/math]
Die erweiterte Exponentialfunktion hat also die Form [math]\displaystyle{ h(t)=(-190) \cdot a^t+210 }[/math]. Wir müssen die Basis [math]\displaystyle{ a }[/math] bestimmen:
[math]\displaystyle{ h(1)=(-190)\cdot a^1+210 }[/math]
[math]\displaystyle{ 77=(-190) \cdot a +210 }[/math]
[math]\displaystyle{ -133=(-190) \cdot a }[/math]
[math]\displaystyle{ 0,7=a }[/math]
Die erweiterte Exponentialfunktion [math]\displaystyle{ h(t)=(-190) \cdot 0,7^t+210 }[/math] modelliert damit die Abkühlung des Zwiebelbrotes. [math]\displaystyle{ y=210 }[/math] ist die Asymptote, da für alle [math]\displaystyle{ t \in \mathbb{D}_h }[/math] gilt, dass [math]\displaystyle{ -190\cdot 0,7^t\lt 0 }[/math] ist. Der Graph von [math]\displaystyle{ h }[/math] nähert sich also der Geraden [math]\displaystyle{ y=20 }[/math] beliebig nah an, berührt diese aber nie. Außerdem ist der Graph von [math]\displaystyle{ h }[/math] streng monoton steigend und eine Rechtskurve, daher beschreibt [math]\displaystyle{ h }[/math] einen beschränkten Wachstumsprozess.
Beschränkter Abnahmeprozess
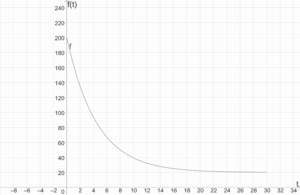
Wir nehmen das fertig gebackene Brot aus dem Ofen. Die Raumtemperatur beträgt 20 °C. Wir modellieren im Folgenden den 30-minütigen Abkühlungsprozess durch eine erweiterte Exponentialfunktion der Form [math]\displaystyle{ f(t)=c \cdot a^t+d }[/math]. Dabei ist [math]\displaystyle{ t }[/math] in Minuten und [math]\displaystyle{ f(t) }[/math] in °C angegeben. Aufgrund der Raumtemperatur, kann das Brot nicht kälter als 20 °C werden, daher gilt [math]\displaystyle{ d=20 }[/math].
Da der Abkühlungsprozess 30 Minuten andauert, ist der Definitionsbereich [math]\displaystyle{ \mathbb{D}_f=[0;30] }[/math]. Temperaturmessungen des Zwiebelbrotes liefern, dass zum Zeitpunkt [math]\displaystyle{ t=0 }[/math] die Temperatur 200 °C und zum Zeitpunkt [math]\displaystyle{ t=1 }[/math] die Temperatur 164 °C beträgt. Damit gilt
[math]\displaystyle{ f(0)=c\cdot a^0+20 }[/math]
[math]\displaystyle{ 200=c+20 }[/math]
[math]\displaystyle{ 180=c }[/math]
Die erweiterte Exponentialfunktion hat also die Form [math]\displaystyle{ f(t)=180 \cdot a^t+20 }[/math]. Wir müssen die Basis [math]\displaystyle{ a }[/math] bestimmen:
[math]\displaystyle{ f(1)=180\cdot a^1+20 }[/math]
[math]\displaystyle{ 164=180 \cdot a +20 }[/math]
[math]\displaystyle{ 144=180 \cdot a }[/math]
[math]\displaystyle{ 0,8=a }[/math]
Die erweiterte Exponentialfunktion [math]\displaystyle{ f(t)=180\cdot 0,8^t+20 }[/math] modelliert damit die Abkühlung des Zwiebelbrotes. [math]\displaystyle{ y=20 }[/math] ist die Asymptote, da für alle [math]\displaystyle{ t \in \mathbb{D}_f }[/math] gilt, dass [math]\displaystyle{ 180\cdot 0,8^t\gt 0 }[/math] ist. Der Graph von [math]\displaystyle{ f }[/math] nähert sich also der Geraden [math]\displaystyle{ y=20 }[/math] beliebig nah an, berührt diese aber nie. Außerdem ist der Graph von [math]\displaystyle{ f }[/math] streng monoton fallend und eine Linkskurve, daher beschreibt [math]\displaystyle{ f }[/math] einen beschränkten Abnahmeprozess.