Lineare Funktion: Unterschied zwischen den Versionen
Keine Bearbeitungszusammenfassung |
Keine Bearbeitungszusammenfassung |
||
| Zeile 2: | Zeile 2: | ||
==Definition== | ==Definition== | ||
Eine Funktion <math>f</math> mit der Funktionsvorschrift <math>f(x)=mx+b</math> heißt '''lineare Funktion''' mit der '''Steigung''' <math>m \in \mathbb{R}</math> und dem '''<math>y</math>-Achsenabschnitt''' <math>b \in \mathbb{R}</math>. Die Gleichung der Geraden ist <math>y=mx+b</math>. Der [[Graph]] einer linearen Funktion ist eine '''Gerade'''. Ein Punkt <math>P(c|d)</math> liegt genau dann auf dem [[Graph]] von <math>f</math>, wenn | Eine Funktion <math>f</math> mit der Funktionsvorschrift <math>f(x)=mx+b</math> heißt '''lineare Funktion''' mit der '''Steigung''' <math>m \in \mathbb{R}</math> und dem '''<math>y</math>-Achsenabschnitt''' <math>b \in \mathbb{R}</math>. Die Gleichung der Geraden ist <math>y=mx+b</math>. Der [[Graph]] einer linearen Funktion ist eine '''Gerade'''. Ein Punkt <math>P(c|d)</math> liegt genau dann auf dem [[Graph]] von <math>f</math>, wenn <math>d=m \cdot c+b</math> gilt. | ||
==Punkt-Steigungsform der Geradengleichung== | ==Punkt-Steigungsform der Geradengleichung== | ||
| Zeile 25: | Zeile 10: | ||
Wenn <math>m=0</math> ist, wird die lineare Funktion als konstante Funktion bezeichnet. | Wenn <math>m=0</math> ist, wird die lineare Funktion als konstante Funktion bezeichnet. | ||
==Schnittpunkt von zwei Geraden bestimmen== | ==Schnittpunkt von zwei Geraden bestimmen== | ||
| Zeile 57: | Zeile 27: | ||
<math>y\ =m_2\frac{b_1-b_2}{m_2-m_1}+b_2</math> | <math>y\ =m_2\frac{b_1-b_2}{m_2-m_1}+b_2</math> | ||
===Parallele und | ==Lagebeziehungen zwischen Geraden== | ||
Orthogonale Geraden | ===Parallele Geraden=== | ||
[[Datei:LineareFunktionParalleleGeraden.png|mini|Parallele Gerade mit <math>f(x)=2 x+3</math> und <math>g(x)=2 x+1</math> ]] | |||
Die Geraden von zwei linearen Funktionen <math>g(x)=m_1x+b_1</math> und <math>f(x)=m_2x+b_2</math> sind parallel, wenn sie sich nicht schneiden. Für parallele Geraden gilt <math>m_1=m_2</math>, d. h. die Steigungen sind gleich. | |||
===Orthogonale Geraden=== | |||
[[Datei:LineareFunktionOrthogonaleGeraden.png|mini|Orthogonale Geraden mit <math>f(x)=2 x+3</math> und <math>f(x)=-\frac{1}{2} x+3</math>]] | |||
Die Geraden von zwei linearen Funktionen <math>g(x)=m_1x+b_1</math> und <math>f(x)=m_2x+b_2</math> sind orthogonal, wenn sie einen rechten Winkel einschließen. Für orthogonale Geraden gilt <math>m_1 \cdot m_2=-1</math> bzw. <math>m_1 =-\frac{1}{m_2}</math>. | |||
==Beispiele== | |||
===Steigung, y-Achsenabschnitt und Graph einer linearen Funktion=== | |||
[[Datei:LineareFunktionenDefinition.png|mini|[[Graph]] von <math>f(x)=2x+2</math> mit Steigung und y-Achsenabschenitt]] | |||
Gegeben ist die Funktion <math>f</math> mit <math>f(x)=2x+2</math>. Der <math>y</math>-Achsenabschnitt ist <math>2</math>, da die Gerade im Punkt <math>(0|2)</math> die <math>y</math>-Achse schneidet. Die Steigung ist <math>2</math>, da man von einem beliebigen Punkt auf der Geraden eine Einheit nach rechts und zwei Einheiten nach oben gehen kann, um wieder auf die Gerade zu kommen. Die Gleichung der Geraden ist <math>y=2x+2</math>. | |||
<html><iframe width="280" height="157.5" src="https://www.youtube.com/embed/VPeVCI3rFUQ?si=AetKtWp6hWlI9OTt" title="YouTube video player" frameborder="0" allow="accelerometer; autoplay; clipboard-write; encrypted-media; gyroscope; picture-in-picture; web-share" allowfullscreen></iframe></html> | |||
===x- und y-Werte einer linearen Funktion berechnen=== | |||
<html><iframe width="280" height="157.5" src="https://www.youtube.com/embed/G9tk7CHKHCA?si=UcqmObFTcXC82LIN" title="YouTube video player" frameborder="0" allow="accelerometer; autoplay; clipboard-write; encrypted-media; gyroscope; picture-in-picture; web-share" allowfullscreen></iframe></html> | |||
===Punktprobe durchführen=== | |||
Wir betrachten wieder die lineare Funktion <math>f(x)=2x+2</math>. Der Punkt <math>P(2|3)</math> liegt nicht auf der Geraden. Dies kann man auch rechnerisch überprüfen. Setzt man die Koordinaten in die Gleichung der Geraden ein, gilt <math>3\neq2\cdot2+2=6</math>. Die rechnerische Überprüfung, ob ein Punkt auf der Geraden der Funktion liegt, heißt '''Punktprobe'''. | |||
<html><iframe width="280" height="157.5" src="https://www.youtube.com/embed/c22sCWXvLBU?si=ODhKc53mv3Hargs2" title="YouTube video player" frameborder="0" allow="accelerometer; autoplay; clipboard-write; encrypted-media; gyroscope; picture-in-picture; web-share" allowfullscreen></iframe></html> | |||
===Punktsteigungsform ermitteln=== | |||
[[Datei:LineareFunktionPunktSteigungsform.png|mini|[[Graph]] von <math>f(x)=1,5x+0</math>]] | |||
Gegeben sind die Punkte <math>P_1(2|3)</math> und <math>P_2(4|6)</math> dann ist <math>m=\frac{6-3}{4-2}=\frac{3}{2}=1,5</math>. Die Gleichung der Punkt-Steigungs-Form ist: | |||
<math>y=1,5(x-2)+3=1,5x-1,5 \cdot 2+3=1,5x-3+3=1,5x</math> | |||
===y-Achsenabschnitt durch Einsetzen eines Punktes berechnen=== | |||
Alternativ können wir b berechnen, indem wir <math>P_1</math> in die Funktion <math>f\left(x\right)=1,5x+b</math> einsetzen: | |||
<math>f\left(x\right)=1,5x+b</math> | |||
<math>3=1,5\cdot 2+b</math> | |||
<math>3=3+b\ |\ -3 </math> | |||
<math>0=b</math> | |||
Also ist die Funktionsvorschrift <math>f\left(x\right)=1,5x</math>. | |||
<html><iframe width="280" height="157.5" src="https://www.youtube.com/embed/ | <html><iframe width="280" height="157.5" src="https://www.youtube.com/embed/VovlNXfugb8?si=vkEsmsV6SaCXUgKf" title="YouTube video player" frameborder="0" allow="accelerometer; autoplay; clipboard-write; encrypted-media; gyroscope; picture-in-picture; web-share" allowfullscreen></iframe></html> | ||
=== | ===Schnittpunkt ermitteln=== | ||
[[Datei:LineareFunktionenSchnittpunkt.png|mini|Schnittpunkt <math>g\left(x\right)=-2x+3</math> von <math>f\left(x\right)=2x-1</math> und <math>g\left(x\right)=-2x+3</math>]] | [[Datei:LineareFunktionenSchnittpunkt.png|mini|Schnittpunkt <math>g\left(x\right)=-2x+3</math> von <math>f\left(x\right)=2x-1</math> und <math>g\left(x\right)=-2x+3</math>]] | ||
Gegeben sind die Funktionen <math>f\left(x\right)=2x-1</math> und <math>g\left(x\right)=-2x+3</math>. | Gegeben sind die Funktionen <math>f\left(x\right)=2x-1</math> und <math>g\left(x\right)=-2x+3</math>. | ||
| Zeile 84: | Zeile 87: | ||
<html><iframe width="280" height="157.5" src="https://www.youtube.com/embed/Vl1HDpwCOgc?si=y9f9QTZUw5Zsp85l" title="YouTube video player" frameborder="0" allow="accelerometer; autoplay; clipboard-write; encrypted-media; gyroscope; picture-in-picture; web-share" allowfullscreen></iframe></html> | <html><iframe width="280" height="157.5" src="https://www.youtube.com/embed/Vl1HDpwCOgc?si=y9f9QTZUw5Zsp85l" title="YouTube video player" frameborder="0" allow="accelerometer; autoplay; clipboard-write; encrypted-media; gyroscope; picture-in-picture; web-share" allowfullscreen></iframe></html> | ||
== | ===Parallele und orthogonale lineare Funktionen berechnen=== | ||
<html><iframe width="280" height="157.5" src="https://www.youtube.com/embed/VhOcdx_ojEk?si=UKZ5qgkGqAhQldV3" title="YouTube video player" frameborder="0" allow="accelerometer; autoplay; clipboard-write; encrypted-media; gyroscope; picture-in-picture; web-share" allowfullscreen></iframe></html> | |||
< | |||
=== | |||
===[[Graph]] einer linearen Funktion mit Wertetabelle zeichnen=== | ===[[Graph]] einer linearen Funktion mit Wertetabelle zeichnen=== | ||
<html><iframe width="280" height="157.5" src="https://www.youtube.com/embed/pZy8ephRE3s?si=nWaI_GC-os-IMmOC" title="YouTube video player" frameborder="0" allow="accelerometer; autoplay; clipboard-write; encrypted-media; gyroscope; picture-in-picture; web-share" allowfullscreen></iframe></html> | <html><iframe width="280" height="157.5" src="https://www.youtube.com/embed/pZy8ephRE3s?si=nWaI_GC-os-IMmOC" title="YouTube video player" frameborder="0" allow="accelerometer; autoplay; clipboard-write; encrypted-media; gyroscope; picture-in-picture; web-share" allowfullscreen></iframe></html> | ||
Version vom 7. Juli 2024, 09:28 Uhr
Lineare Funktionen sind ein wesentlicher Bestandteil der Analysis und damit ein Gebiet der Mathematik. Sie haben viele praktische Anwendungen in verschiedenen Bereichen wie Wirtschaft, Ingenieurwesen, Naturwissenschaften und Sozialwissenschaften und beschreiben die Beziehung zwischen zwei Variablen, die linear miteinander verbunden sind, und können verwendet werden, um Trends, Muster und Veränderungen im Verhalten von Phänomenen zu analysieren und vorherzusagen.
Definition
Eine Funktion [math]\displaystyle{ f }[/math] mit der Funktionsvorschrift [math]\displaystyle{ f(x)=mx+b }[/math] heißt lineare Funktion mit der Steigung [math]\displaystyle{ m \in \mathbb{R} }[/math] und dem [math]\displaystyle{ y }[/math]-Achsenabschnitt [math]\displaystyle{ b \in \mathbb{R} }[/math]. Die Gleichung der Geraden ist [math]\displaystyle{ y=mx+b }[/math]. Der Graph einer linearen Funktion ist eine Gerade. Ein Punkt [math]\displaystyle{ P(c|d) }[/math] liegt genau dann auf dem Graph von [math]\displaystyle{ f }[/math], wenn [math]\displaystyle{ d=m \cdot c+b }[/math] gilt.
Punkt-Steigungsform der Geradengleichung
Sind zwei Punkte [math]\displaystyle{ P_1(x_1| y_1) }[/math] und [math]\displaystyle{ P_2(x_2| y_2) }[/math] gegeben, dann lässt sich eindeutig eine Gerade durch diese beiden Punkte zeichnen. Falls [math]\displaystyle{ x_1 \neq x_2 }[/math], ist dies der Graph einer linearen Funktion. Die Steigung dieser Geraden ist dann [math]\displaystyle{ m=\frac{y_2-y_1}{x_2-x_1} }[/math]. Die Gleichung der Geraden kann in der Punkt-Steigungs-Form angegeben werden:
[math]\displaystyle{ y=m(x-x_1) +y_1 }[/math]
Wenn [math]\displaystyle{ m=0 }[/math] ist, wird die lineare Funktion als konstante Funktion bezeichnet.
Schnittpunkt von zwei Geraden bestimmen
Sind zwei lineare Funktionsvorschriften [math]\displaystyle{ y\ =m_1x+b_1 }[/math] und [math]\displaystyle{ y\ =m_2x+b_2 }[/math] gegeben, dann kann die Schnittstelle durch Gleichsetzen und Umformen nach [math]\displaystyle{ x }[/math] errechnet werden:
[math]\displaystyle{ m_2x+b_2=\ m_1x+b_1\ |-\ b_2 }[/math]
[math]\displaystyle{ m_2x=\ m_1x+b_1-b_2\ |-m_1x }[/math]
[math]\displaystyle{ m_2x-m_1x=\ b_1-b_2\ |\ x\ \text{ausklammern} }[/math]
[math]\displaystyle{ {x(m}_2-m_1)=\ b_1-b_2\ |\ \div\ {(m}_2-m_1) }[/math]
[math]\displaystyle{ x=\ \frac{b_1-b_2}{m_2-m_1} }[/math]
Der dazugehörige [math]\displaystyle{ y }[/math]-Wert wird durch Einsetzen in eine der Funktionsvorschriften, z. B. [math]\displaystyle{ y\ =m_2x+b_2 }[/math], berechnet: [math]\displaystyle{ y\ =m_2\frac{b_1-b_2}{m_2-m_1}+b_2 }[/math]
Lagebeziehungen zwischen Geraden
Parallele Geraden
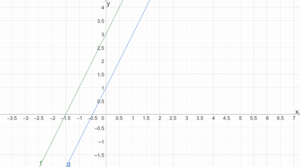
Die Geraden von zwei linearen Funktionen [math]\displaystyle{ g(x)=m_1x+b_1 }[/math] und [math]\displaystyle{ f(x)=m_2x+b_2 }[/math] sind parallel, wenn sie sich nicht schneiden. Für parallele Geraden gilt [math]\displaystyle{ m_1=m_2 }[/math], d. h. die Steigungen sind gleich.
Orthogonale Geraden
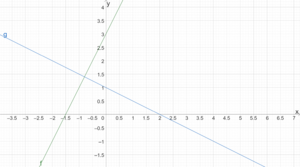
Die Geraden von zwei linearen Funktionen [math]\displaystyle{ g(x)=m_1x+b_1 }[/math] und [math]\displaystyle{ f(x)=m_2x+b_2 }[/math] sind orthogonal, wenn sie einen rechten Winkel einschließen. Für orthogonale Geraden gilt [math]\displaystyle{ m_1 \cdot m_2=-1 }[/math] bzw. [math]\displaystyle{ m_1 =-\frac{1}{m_2} }[/math].
Beispiele
Steigung, y-Achsenabschnitt und Graph einer linearen Funktion
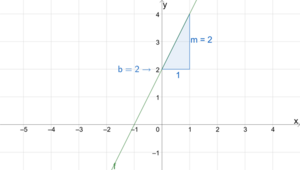
Gegeben ist die Funktion [math]\displaystyle{ f }[/math] mit [math]\displaystyle{ f(x)=2x+2 }[/math]. Der [math]\displaystyle{ y }[/math]-Achsenabschnitt ist [math]\displaystyle{ 2 }[/math], da die Gerade im Punkt [math]\displaystyle{ (0|2) }[/math] die [math]\displaystyle{ y }[/math]-Achse schneidet. Die Steigung ist [math]\displaystyle{ 2 }[/math], da man von einem beliebigen Punkt auf der Geraden eine Einheit nach rechts und zwei Einheiten nach oben gehen kann, um wieder auf die Gerade zu kommen. Die Gleichung der Geraden ist [math]\displaystyle{ y=2x+2 }[/math].
x- und y-Werte einer linearen Funktion berechnen
Punktprobe durchführen
Wir betrachten wieder die lineare Funktion [math]\displaystyle{ f(x)=2x+2 }[/math]. Der Punkt [math]\displaystyle{ P(2|3) }[/math] liegt nicht auf der Geraden. Dies kann man auch rechnerisch überprüfen. Setzt man die Koordinaten in die Gleichung der Geraden ein, gilt [math]\displaystyle{ 3\neq2\cdot2+2=6 }[/math]. Die rechnerische Überprüfung, ob ein Punkt auf der Geraden der Funktion liegt, heißt Punktprobe.
Punktsteigungsform ermitteln
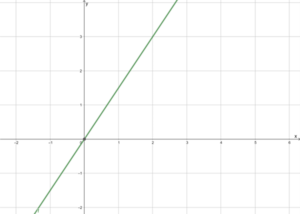
Gegeben sind die Punkte [math]\displaystyle{ P_1(2|3) }[/math] und [math]\displaystyle{ P_2(4|6) }[/math] dann ist [math]\displaystyle{ m=\frac{6-3}{4-2}=\frac{3}{2}=1,5 }[/math]. Die Gleichung der Punkt-Steigungs-Form ist: [math]\displaystyle{ y=1,5(x-2)+3=1,5x-1,5 \cdot 2+3=1,5x-3+3=1,5x }[/math]
y-Achsenabschnitt durch Einsetzen eines Punktes berechnen
Alternativ können wir b berechnen, indem wir [math]\displaystyle{ P_1 }[/math] in die Funktion [math]\displaystyle{ f\left(x\right)=1,5x+b }[/math] einsetzen: [math]\displaystyle{ f\left(x\right)=1,5x+b }[/math] [math]\displaystyle{ 3=1,5\cdot 2+b }[/math] [math]\displaystyle{ 3=3+b\ |\ -3 }[/math] [math]\displaystyle{ 0=b }[/math] Also ist die Funktionsvorschrift [math]\displaystyle{ f\left(x\right)=1,5x }[/math].
Schnittpunkt ermitteln
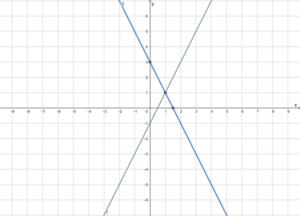
Gegeben sind die Funktionen [math]\displaystyle{ f\left(x\right)=2x-1 }[/math] und [math]\displaystyle{ g\left(x\right)=-2x+3 }[/math].
Gleichsetzen liefert
[math]\displaystyle{ 2x-1=-2x+3\ |+1 }[/math]
[math]\displaystyle{ 2x=-2x+4\ |+2x }[/math]
[math]\displaystyle{ 4x=\ 4\ |\div4 }[/math]
[math]\displaystyle{ x=\ 1 }[/math]
und Einsetzen von [math]\displaystyle{ x }[/math] ergibt
[math]\displaystyle{ f\left(1\right)=2\cdot 1-1=1 }[/math]
Also ist der Schnittpunkt [math]\displaystyle{ S\left(1|1\right) }[/math]
Parallele und orthogonale lineare Funktionen berechnen
Graph einer linearen Funktion mit Wertetabelle zeichnen