Nicht kategorisierte Dateien
Nachfolgend werden bis zu 50 Ergebnisse im Bereich 51 bis 100 angezeigt.
-
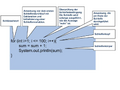
 Console BlueJ.png 711 × 655; 44 KB
-
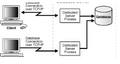
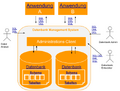 DBMS-Darstellung.png 559 × 426; 55 KB
-
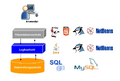
 DBMS-MySQL.png 775 × 512; 252 KB
-
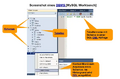
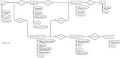
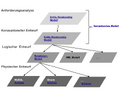
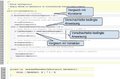
 DBMS-Schichten.png 727 × 491; 144 KB
-
 DBMS-Server.png 583 × 310; 66 KB
-
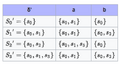 DEA Beipsiel.png 464 × 247; 39 KB
-
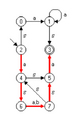
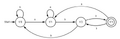 DEA Graph.png 975 × 318; 50 KB
-
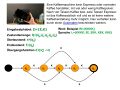 DEA Kaffeeautomat.jpg 960 × 720; 85 KB
-
 DQLDatenbasisERM.jpg 1.280 × 621; 93 KB
-
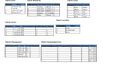 DQLDatenbasisTabellen.jpg 1.280 × 788; 146 KB
-
 Datenbanktabelle.jpg 960 × 720; 51 KB
-
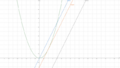
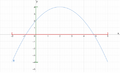
 DifferentialrechnungBeispielGraphHochTief.png 642 × 363; 32 KB
-
 DifferentialrechnungBeispielTangente.png 642 × 363; 34 KB
-
 DifferentialrechnungBeispielfAbl.png 642 × 364; 26 KB
-
 DifferentialrechnungBeispielgAbl.png 642 × 364; 27 KB
-
 DifferentialrechnungBoptBmin.png 455 × 291; 56 KB
-
 DifferentialrechnungTangentePassSek.png 642 × 363; 41 KB
-
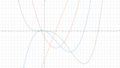 DifferentialrechnungWende.png 606 × 343; 56 KB
-
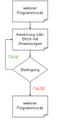 Do-while.png 815 × 1.717; 156 KB
-
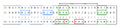 Dopplung Chiffrate.png 789 × 173; 36 KB
-
 Drei-Schichten-Architektur.jpg 960 × 720; 42 KB
-
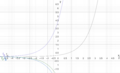
 E-FunktionGraphen1.png 3.000 × 1.916; 691 KB
-
 ENEA.png 264 × 437; 21 KB
-
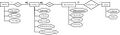 ER-Diagramm-Beispiel.jpg 983 × 284; 68 KB
-
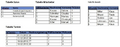 ER-Modell-Tabellen.png 1.681 × 654; 685 KB
-
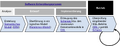
 ERM-Einordnung.png 967 × 743; 78 KB
-
 ERM-Softwarentwicklungsprozess.png 976 × 374; 79 KB
-
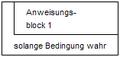
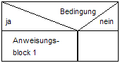 EinfacheAuswahl.png 170 × 89; 2 KB
-
 Endzustand.jpg 69 × 70; 2 KB
-
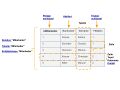
 Entität-ErklärungAnTabelle.png 987 × 517; 72 KB
-
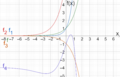
 ExponentialfunktionBasen.png 3.000 × 1.822; 710 KB
-
 ExponentialfunktionBeschränkterAbnahmeprozess.png 3.000 × 1.954; 669 KB
-
 ExponentialfunktionBeschränkterWachstumsprozess.png 3.000 × 1.958; 747 KB
-
 ExponentialfunktionFaktoren.png 3.000 × 1.822; 667 KB
-
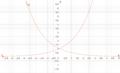 ExponentialfunktionSpiegelbildlich.png 3.000 × 1.822; 639 KB
-
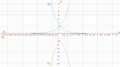 ExponentialfunktionVerlauf.png 3.000 × 1.673; 571 KB
-
 Fakultät.png 230 × 49; 769 Bytes
-
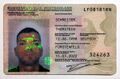 Fiktiver Personalausweise mit personenbezogenen Daten.jpg 1.200 × 787; 372 KB
-
 For-schleife.png 1.587 × 1.186; 705 KB
-
 Formel Entropie.png 250 × 50; 2 KB
-
 Formel Wahrscheinlichkeit Ereignisse.png 86 × 33; 885 Bytes
-
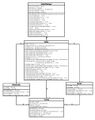 Friseur Salon UML Klassendiagramm.jpg 960 × 1.212; 262 KB
-
 FunktionenDefinitionsbereichWertebereich.png 482 × 292; 30 KB
-
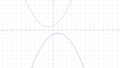
 FunktionenGraphEinerFunktion.png 3.000 × 1.684; 490 KB
-
 FussgesteuerteSchleife.png 157 × 75; 2 KB
-
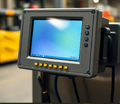 Gabelstapler-Terminal.png 901 × 784; 570 KB
-
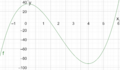 GanzrationaleFunktionBeispiel.png 3.000 × 1.759; 570 KB
-
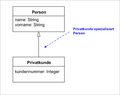 Generalizierung UML.png 300 × 237; 14 KB
-
 Gestaltung-Verzweigungen.png 1.587 × 1.040; 1,01 MB
-
 GewinnanalyseErtragsKosGrenzk.png 642 × 347; 43 KB


